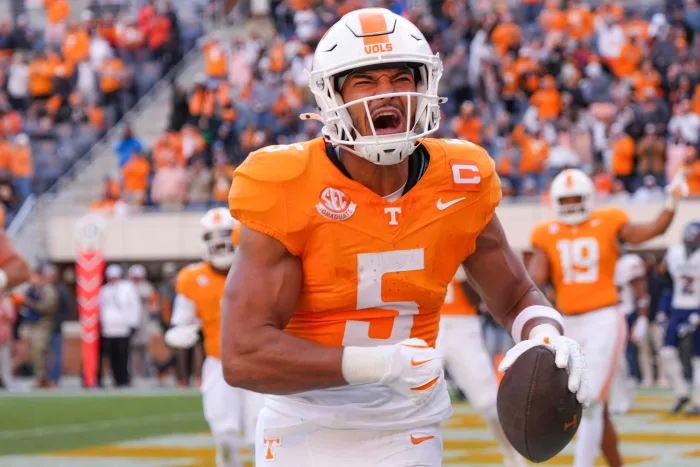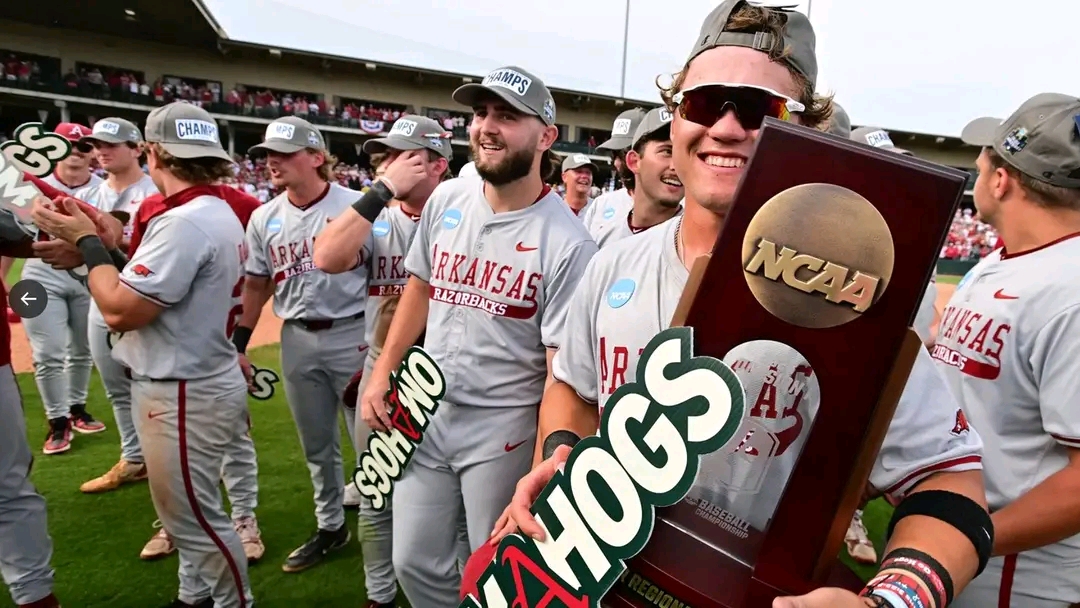
COLLEGE WORLD SERIES SHOWDOWN: Arkansas Stat Breakdown Reveals Who Holds the Edge as SEC Titans Collide in Omaha
OMAHA, NE — The Road to Omaha has led us to a colossal SEC showdown that promises fireworks: the Arkansas Razorbacks and LSU Tigers are set to clash in the College World Series, and the numbers tell a compelling story. With both teams boasting elite-level talent and national pedigree, a closer look at the key statistics gives insight into where each program might hold an advantage—and where things are dead even.
Here’s a full breakdown of how these two powerhouses match up across offense, defense, and resume metrics heading into this crucial CWS battle.
—
🔥 OFFENSE: Power vs. Consistency
Scoring Offense
Arkansas: 8.8 Runs/Game (15th)
LSU: 7.9 Runs/Game (48th)
The Hogs have been lighting up the scoreboard all season, averaging nearly 9 runs per game, good for No. 15 in the nation. LSU, while still dangerous, comes in nearly a full run behind at 7.9—ranked 48th nationally. This margin may seem slim on paper, but in Omaha where pitching tightens up and runs come at a premium, every edge matters.
Batting Average
Arkansas: .313 (15th)
LSU: .300 (47th)
Arkansas again claims the edge in batting average. Their .313 team clip shows just how deep and relentless this lineup can be. LSU is no slouch at .300, but it’s clear the Razorbacks have a slight advantage when it comes to getting on base and generating rallies.
Home Runs
Arkansas: 124 HRs (4th)
LSU: 100 HRs (19th)
In the long ball category, Arkansas flexes major muscle. With 124 homers—4th in the nation—the Razorbacks are one of the most explosive teams in the country. LSU has hit the century mark, which still ranks top 20 nationally, but they’re playing catch-up in the power department. The question is: will the bigger park in Omaha neutralize this advantage?
Slugging Percentage
Arkansas: .558 (6th)
LSU: .516 (23rd)
Slugging tells the story of Arkansas’ dangerous mix of gap-to-gap power and deep threats. Their .558 slugging percentage places them comfortably in the top 10, compared to LSU’s still-strong .516. This Arkansas lineup doesn’t just score—it hammers.
Verdict: Advantage Arkansas 🐗
From top to bottom, the Razorbacks are one of the most complete offensive units in college baseball. Whether it’s small ball or long ball, they’re executing at a higher level than LSU statistically. The Tigers can absolutely erupt—but on paper, the Razorbacks bring more firepower to the dish.
—
🛡️ DEFENSE: Pitching Precision and Gloves That Don’t Miss
Team ERA
LSU: 3.80 (9th)
Arkansas: 3.91 (10th)
A razor-thin margin separates these two staffs. LSU gets the slight nod in ERA, ranking 9th nationally, just ahead of Arkansas at 10th. Both units have consistently shut down quality opposition. With CWS pitching depth being critical, it’s almost a dead heat.
WHIP (Walks + Hits/Innings Pitched)
Arkansas: 1.21 (6th)
LSU: 1.30 (15th)
WHIP gives Arkansas a bit more breathing room—6th in the country versus LSU’s 15th. This stat reflects how well a team limits base runners, and Arkansas is simply more efficient in that department. Expect fewer self-inflicted wounds from the Razorback arms.
Strikeout-to-Walk Ratio
Arkansas: 3.57 (1st)
LSU: 2.74 (14th)
Here’s where Arkansas really stands apart. The Hogs lead the nation in K-to-BB ratio. They don’t just strike batters out—they avoid free passes better than anyone in the country. LSU is solid at 14th, but Arkansas is elite. That could be the X-factor in high-pressure late innings.
Fielding Percentage
Arkansas: .984 (1st)
LSU: .981 (11th)
Defensively, Arkansas again holds the gold standard. A .984 fielding percentage places them atop the national leaderboard. LSU, at .981, is no liability, but a few extra unearned runs or infield misfires in Omaha can swing an entire season.
Verdict: Slight Edge Arkansas 🐗
It’s close—very close. But the combination of elite control on the mound and near-flawless defense makes Arkansas the more statistically sound team on the defensive end. LSU’s pitching is better than advertised, but Arkansas’ efficiency is next-level.
—
🧮 Quad 1 Record (vs. Elite Teams)
Arkansas: 16-9
LSU: 15-10
Against the best of the best—Quad 1 competition—both teams have proven they belong. Arkansas holds a narrow edge in both winning percentage and total wins. These records speak to experience in tight, high-stakes environments—another tick in the box for the Hogs.
—
📈 What the Numbers Say: Razorbacks Slightly Favored
Statistically, Arkansas holds a modest but meaningful advantage heading into this showdown. Their offense ranks better across the board—more runs, more homers, higher average, and greater slugging. On the mound and in the field, the margins are slimmer, but the Razorbacks still maintain the upper hand in WHIP, strikeout-to-walk ratio, and fielding percentage.
LSU is not outmatched. Far from it. Their pitching staff is elite, and their battle-tested lineup is capable of turning any game on its head. They’ve got pop, poise, and plenty of pedigree.
But in a tournament defined by details—who hits the clutch double, who turns the double play, who avoids the big walk—Arkansas’ statistical edge might just be the difference.
—
🕶️ X-Factors to Watch
Omaha Dimensions: Will Arkansas’ power travel in the larger ballpark? Can LSU manufacture more runs if the long ball is limited?
Bullpen Depth: With multiple close games likely, late-inning matchups could determine everything.
Defensive Cleanliness: Errors are magnified in elimination games. Arkansas has the cleaner resume.
—
📣 Final Word
This SEC duel is a dream College World Series matchup. LSU has the history. Arkansas has the edge on the stat sheet. Now they meet where legends are made, and only one team can keep the title dream alive.
Buckle up—because this one might go the distance.
#Razorbacks #Tigers #CWS #RoadToOmaha #ArkansasBaseball #LSUBaseball 🐗🐯⚾️